London Fire Brigade attendance times in Waltham Forest: are they delayed by road closures?
The paper reproduced below is by local resident Steve Lowe, and looks in detail at the vexed issue of whether LBWF programmes such as Mini-Holland and low traffic neighbourhoods have impacted on London Fire Brigade attendance times in the borough.
We are grateful to Mr. Lowe for permission to reproduce what is a very interesting, well researched, and, above all, convincing contribution to the debate.
‘London Fire Brigade Attendance Times in Waltham Forest: Are They Delayed by Road Closures?
By Steve Lowe, 01 May 2021
‘Context and Purpose of This Document
There is understandable anxiety that road closures – initially implemented as part of the “Mini-Holland” programme of the London Borough of Waltham Forest (LBWF), and more recently in pursuit of creating “low traffic neighbourhoods” (LTNs) – delay response and attendance times of the emergency services.
However, the materiality of any emergency-service delay because of road closures is routinely denied by LBWF. This position is based largely on the considerable liaison that LBWF undertakes with the emergency services, both statutorily and informally, the minutes of which have rarely – if ever – identified significant concerns on the part of the emergency services.
This note addresses the possible impact of road closures in Waltham Forest on attendance times of the first London Fire Brigade (LFB) pump appliance sent to an emergency incident. The data employed are readily available in the public domain.
For almost all incidents in Waltham Forest, the first pump appliance is despatched from one of the four fire stations located in Waltham Forest, viz Chingford, Walthamstow, Leyton and Leytonstone. For London as a whole, the LFB seeks formally to achieve, or better, an average annual first-pump attendance time of six minutes. Less formally, the LFB endeavours to meet this average at the London borough level.
LBWF commenced its “Mini-Holland” programme in 2015, with a complex set of road closures in Walthamstow Village. The programme of closures has subsequently been rolled out across other parts of Walthamstow and Leyton, though hardly at all in Chingford and Leytonstone. Another major feature of “Mini-Holland” has been the creation of cycle-tracks alongside main roads; typically, the cycle-tracks have reduced the carriageway-widths of the roads concerned.
The anxiety that road closures may have delayed emergency-service attendance because first-responders are forced to travel longer distances to at least some incidents is compounded by the greater congestion that emergency-service vehicles are likely to encounter on the main roads that are carrying additional traffic displaced by the road closures on carriageways with less capacity, having been narrowed by creation of the cycle-tracks.
This note finds that there is substantial evidence to support the contention that the attendance of the LFB at emergencies in Waltham Forest has been delayed by the road closures that have been introduced extensively in the borough.
The remainder of this note is structured as follows;
Section 2 – Data Analysis: Waltham Forest
Section 3 – Comparison with Outer London
Section 4 – Conclusions
Data and Analysis: Waltham Forest
As already noted, the data employed in this note are in the public domain and can be found on the London Datastore website [1] as both a pdf and an Excel workbook. They are respectively:
Fire Facts – Incident response times 2920.pdf
Fire Facts – Incident response times 2020 final.xslx
Both sources offer extensive data on incident response times for all stages of the process, from how long was taken to answer 999 calls, through the time taken to alert fire stations, turn-out appliances and travel to incidents. Of particular interest in this note are the latter two components of response times; together, crew turn-out times and travel times to incidents make up first-appliance (pump) attendance times. [2]
The data sources detail crew turn-out times and first-appliance attendance times. Averages are given for incidents in each London borough and collectively for London as a whole, for inner London, and for outer London. These data are shown as annual averages for each year from 2010 to 2020 inclusive.
Crew turn-out times will not be affected by road closures, either directly because of longer distances to reach incidents or because of additional traffic congestion on major roads. On the other hand, travel times to incidents are the component of overall response times that will be affected by road closures, if there is an impact on attendance times. While travel times to incidents are not explicit in the data sources, they can be easily computed by subtracting crew turn-out times from first-appliance attendance times. Thus below are tabulated:
(a) First-appliance attendance times, taken directly from the sources (Chapter 5);
(b) Crew turn-out times, also taken directly from the sources (Chapter4);
(c) Travel times to incidents, computed as the attendance times less turn-out times.
The following table relates to incidents in Waltham Forest.
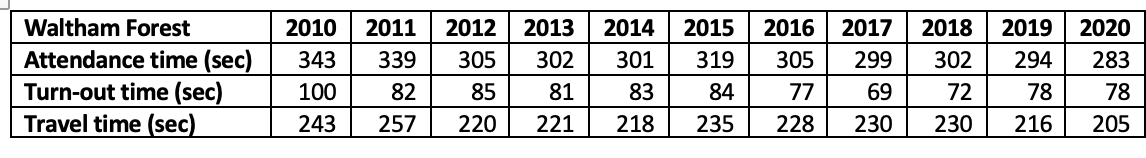
It has been argued that, if road closures introduced in 2015 were the cause of the increase in attendance times in that year compared to immediately preceding years (319 seconds compared to – for example – 301 seconds in 2014), any such effect was short-lived, since attendance times from 2016 onwards fall back towards and even below 2014 and earlier attendance times. For instance, Goodman et al speculate that “Delays such as needing to detour around a modal filter [that is, a road closure] may be more visible and salient to firefighters than other causes of delay, particularly soon after a scheme is implemented.” [3]
When turn-out times are inspected, however, it is clear that there was a noticeable and persistent reduction from 2016 onwards. The reason for this appears to have been the introduction by the LFB in Waltham Forest of an improved despatch system that targeted a reduction in crew turn-out times. [4]
Subtracting turn-out times from attendance times gives travel times. It is clear that these increased markedly in 2015 (235 seconds) compared to 2014 (218 seconds). They then remained appreciably higher than 2014 from 2014 to 2018, and only fell seriously below the 2014 level in 2020, when – it might be surmised – Coronavirus lockdowns for much of the year reduced traffic and hence the congestion with which emergency services had to contend.
Thus, save for 2020, the reduction in attendance times after the 2015 high point appears to be the combination of improvements in turn-out times off-setting increases in travel times. This is thoroughly consistent with a continuing impact of road closures on attendance times from 2015 onwards that is obscured by the improvement in turn-out times.
That said, from the point of view of the LFB, the important finding would be that average attendance times have stayed below – well below, in fact – the six-minute or 360-second target, irrespective of any impact from road closures. Thus over four meetings between the LFB and LBWF between January and July 2016 at which “station and Borough attendance times were monitored”, [5] the LFB reported that “No issues were highlighted as LFB is achieving the attendance target to get the first fire engine to an incident in an average of six minutes”. [6]
While the results just described are consistent with delays because of road closures, they could instead be due to some other cause that was not isolated to Waltham Forest. [7] To check this out, the data for Waltham Forest can be compared with corresponding data for Outer London as a whole. First, however, the Waltham Forest data will be “normalised” relative to a benchmark of 2014:
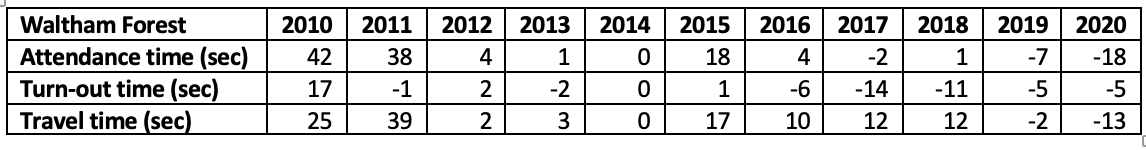
This table makes crystal-clear how increases in travel times from 2015 have been offset by improvements in crew turn-out times from 2016, to give the impression picked up by Goodman et al [8] that attendance times had not deteriorated after an initial blip in 2015.
Comparison with Outer London
Turning now to Outer London, which includes Waltham Forest but also 18 other London boroughs, [9] the data for attendance times, turn-out times and travel times are as follow.
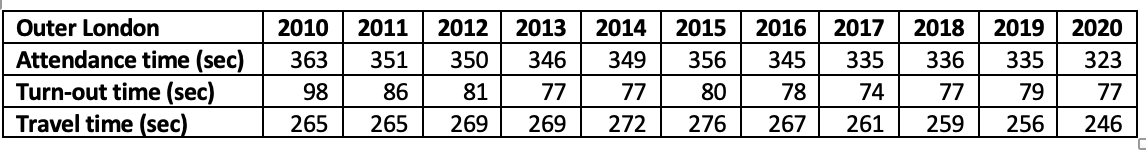
A first point to notice is that average attendance times for Outer London as a whole are much closer to the six-minute or 360-second target than for Waltham Forest on its own. It would be understandable, therefore, if the LFB were more exercised by the results for other Outer London boroughs than for Waltham Forest, even if road closures in Waltham Forest may have worsened attendance times. This could account for the somewhat “laid back” tone of LFB’s observation quoted above.
Within Outer London attendance times, however, the pattern of turn-out times and travel times over the years, especially from 2014 onwards, is very different from those for Waltham Forest. Outer London turn-out times hardly varied while Waltham Forest’s decreased, and Outer London’s travel times decreased while Waltham Forest’s increased.
The pattern for Outer London is better illustrated by – as was done for the Waltham Forest data – “normalising” relative to a 2014 benchmark:
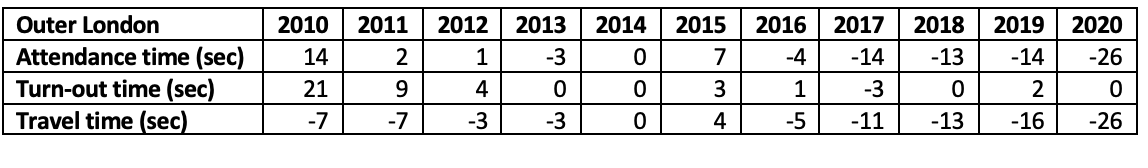
This confirms that there was no real change in Outer London turn-out times from 2014 onwards, while Outer London travel times are on a downward trend over this period.
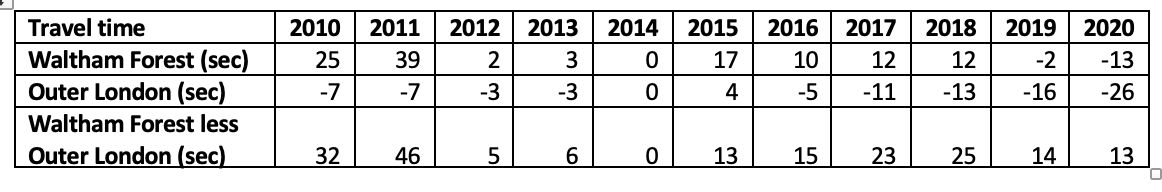
The stark contrast between the Outer London and Waltham Forest data can be seen in the following sequence of tables. Here, the 2014-normalised results are brought together, with the difference in these results between Waltham Forest and Outer London also shown.
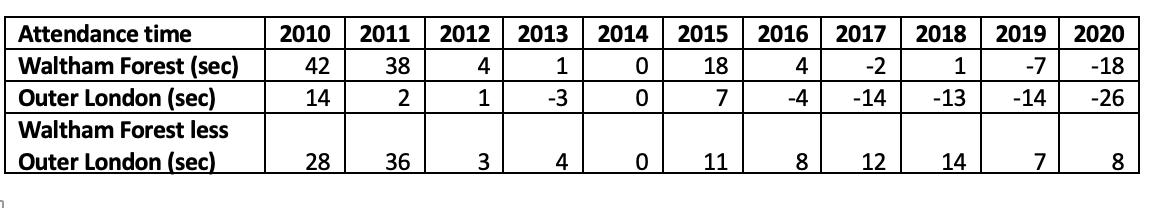
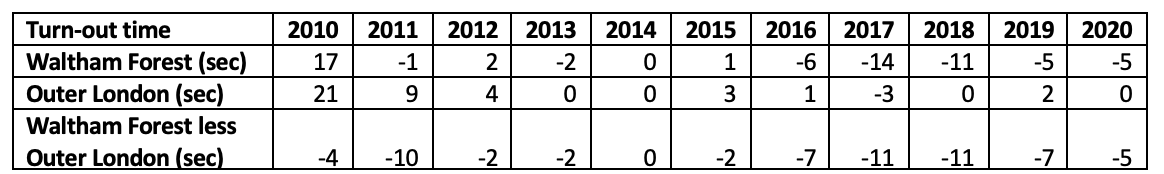
Negative differences indicate that, against the 2014 benchmark, Waltham Forest times improved compared to Outer London times as a whole. This is very clearly the case for turn-out times.
In complete contrast, the positive differences for travel times show how Waltham Forest’s results worsened markedly compared to Outer London’s. In 2018, for example, the difference had risen to 25 seconds since 2014, comprising – relative to that year – an improvement in Outer London’s performance of 13 seconds and a deterioration in Waltham Forest’s of 12 seconds.
The only clear exception to Waltham Forest’s deterioration is for 2020, which was surmised earlier to be the effect of Coronavirus lockdowns in reducing traffic congestion. If that was really the cause, it would be expected to be evident in the aggregate Outer London results as well. Indeed it is; 2020 average travel times for Waltham Forest are 11 seconds better than in 2019, while 2020 travel times for Outer London are 10 seconds better than in 2019.
Conclusions
Returning to consideration of the pre-Coronavirus years, it must be concluded that, at the very least, the divergences between Waltham Forest and Outer London in the direction of change of turn-out times and travel times demonstrate that there were impacts on attendance times for Waltham Forest that varied markedly from those affecting the Outer London boroughs in aggregate.
With regard to Waltham Forest’s improvement in turn-out times compared to Outer London’s, this followed implementation of a new despatch system (see above) at the fire stations in the borough.
That leaves the deterioration in Waltham Forest’s travel times from 2015 onwards to be explained, when travel times for Outer London as a whole were improving. As previously stated, 2015 also marked the start of LBWF’s “Mini-Holland” programme.
Given this correspondence of timing as well as the marked difference in travel times between Waltham Forest and the generality of Outer London, the most plausible explanation for this distinction is LBWF’s “Mini-Holland” programme of road closures, coupled with the heightened congestion caused by the narrowing of main-road carriageways that also are carrying additional traffic displaced from closed roads.
Notes
- https://data.london.gov.uk/dataset/incident-response-times-fire-facts
- “Our fire engine response standards are measured from the time LFB control operators mobilise the first (and subsequent) fire engine to an incident to when the fire engine arrives at the incident location. This time therefore includes the crew turn out time…” (LFB, 2021: Fire Facts – Incident response times 2020.pdf, p12).
- Goodman, Anna, Anthony A Laverty, and Rachel Aldred. 2020. “The Impact of Introducing a Low Traffic Neighbourhood on Fire Service Emergency Response Times, in Waltham Forest London.” Findings, December.
- The new system was explained to the present writer and a colleague by the LFB Borough Commander for Waltham Forest at an “open day” at Leytonstone fire station in December 2016. The Commander was proud of the improvement in turn-out times that had resulted.
- LFB Freedom of Information response FOIA2688.1
- Ibid
- While LTNs are now ubiquitous across a good many London boroughs, this has developed only in 2020 and 2021; prior to that Waltham Forest was alone in its intensive implementation of (what have become called) LTNs.
- op cit
- Barking and Dagenham, Barnet, Bexley, Brent, Bromley, Croydon, Ealing, Enfield, Greenwich, Harrow, Havering, Hillingdon, Hounslow, Kingston upon Thames, Merton, Redbridge, Richmond upon Thames, Sutton’.